Summer Flounder Fishing in New York
When summer flounder are caught across New York, season by season, from NOAA’s recreational catch survey (2024).
Summer Flounder catch through the year
Recreational catch in New York by two-month season. The peak window is highlighted.
Catch more summer flounder
Seasonal catch, tides, and the day's conditions worth knowing for your spots, plus the occasional PATHR update. No spam.
Catching summer flounder in New York
Summer Flounder catches in New York run hardest around Jul-Aug, with the strongest two-month windows in Jul-Aug and May-Jun. Anglers keep about 5% of what they catch and release the rest. All of this comes from NOAA’s recreational catch survey, so it maps the season rather than any single day.
To turn the season into a trip, line the peak window up with the daily bite. Check the New York fishing times for the solunar windows, the tide charts for moving water, and the sunrise and sunset times for first and last light.
Frequently asked
When is the best time to catch summer flounder in New York?+
Catches peak around Jul-Aug (July and August). The strongest two-month windows are Jul-Aug and May-Jun. This is based on NOAA's 2024 recreational catch survey, so it reflects the typical season rather than a live report.
Do anglers keep or release summer flounder in New York?+
Across New York, about 5% of the summer flounder caught are kept and 95% are released. That works out to roughly 599K kept and 11M released in 2024.
How many summer flounder are caught in New York?+
NOAA's survey estimated about 12M summer flounder caught by recreational anglers in New York in 2024, making it the #2 most-caught species in the state. Survey estimates, so read them as the shape of the season.
Where does this summer flounder data come from?+
NOAA's Marine Recreational Information Program (MRIP), 2024 estimates. Courtesy: National Oceanic and Atmospheric Administration.
You've got the seasons. Now put the water on your chart.
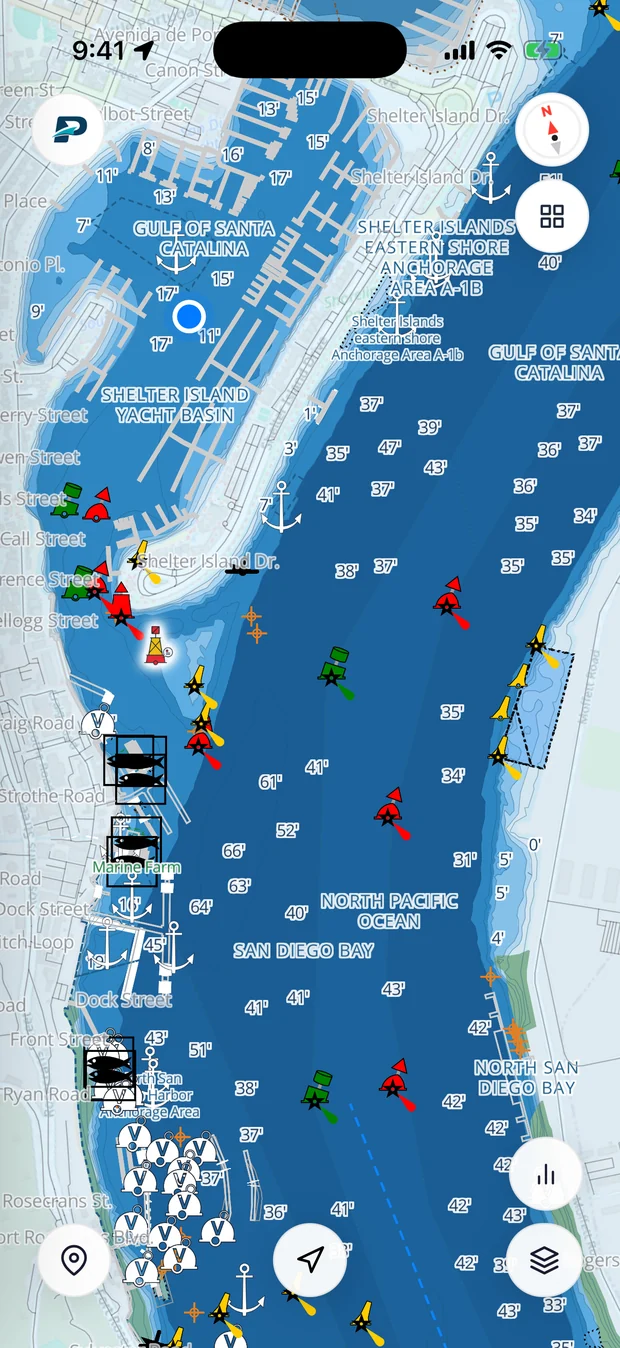
Pathr shows this spot live, the depth under your keel, the tide, wind, and traffic, on one nautical chart.
Love the free tools? Back us as a Founding member.